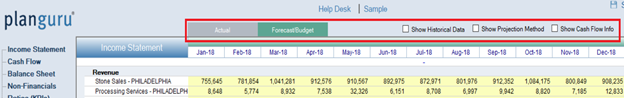
The Data View Tabs allow you to view additional information within each given financial statement.
There are five such tabs after initial setup with a sixth added after you archive your budget. The following is a demonstration of what each one does.
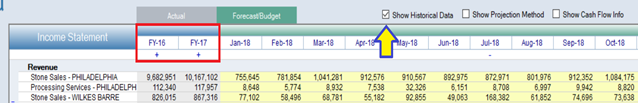
Show Historical Data
The Show historical data tab allows users to expand or collapse the historical years contained in the analysis. PlanGuru allows you to load up to 5 years of historical data by interim period (month or quarter).
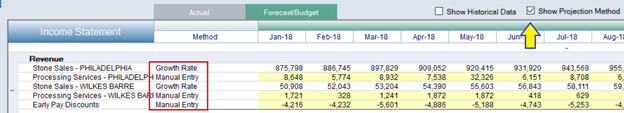
Show Projection Method
To see which projection method is being used for each of your analyses click the Show Projection Method tab.
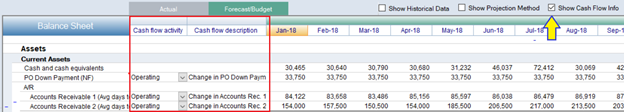
Show Cash Flow Info
To view or alter the default Cash Flow Treatment click the Show Cash Flow Info tab.
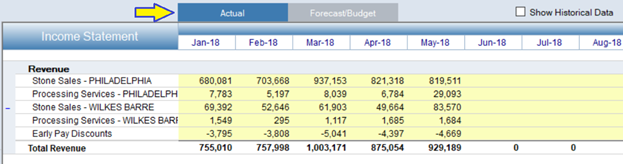
Actuals
To view your realized Actual results select the Actual tab.
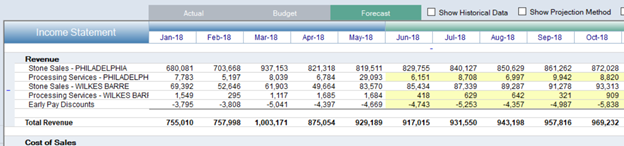
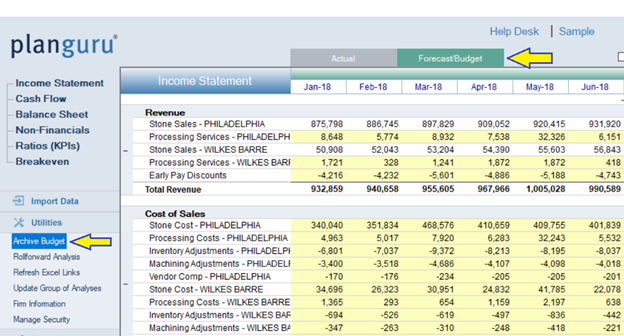
Forecast/Budget
By default, PlanGuru’s grid will show the Forecasted/Budget tab, this is because initially our forecast and budget are the same thing but as time passes we realize actual results and may want to adjust our numbers without losing our initial budget.
To do this ill go to utilities and select the Archive budget feature.
Then select the budget tab to view your budgeted numbers.
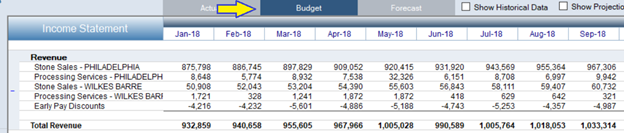
We can then update our forecast with actual results. Accounts not set to manual will adjust based on entered data giving you’re an accurate forecast as the year progresses.