-
First, if you have not yet installed the Excel Add-in you can download and install it from here (.xlam file for Windows) .
-
- Before connecting to a Scenario or doing anything else, the Excel workbook must be saved. This is so the Add-in knows which file path to follow. Where this file is saved should not matter, so long as it is saved somewhere.
- If you need to switch to a different login the next step should be to right click anywhere and clicking "Logout"
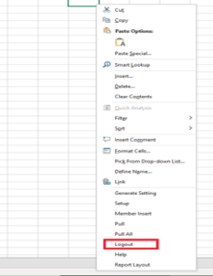
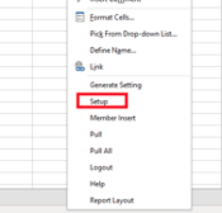
- Once that is done you can log in to the account you wish to use by clicking "Setup".
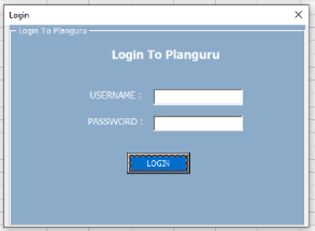
- This will bring up the login screen, where you will login to your PlanGuru App account.
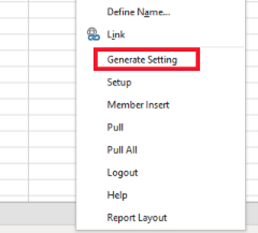
- Once logged in successfully, you can start building out the elements needed to pull your report(s). The first step should be inserting the Workbook Level Settings Tab. This is done by right clicking and selecting “Generate Setting”.
This will bring you to the newly created “Workbook Level Settings” tab in Excel.
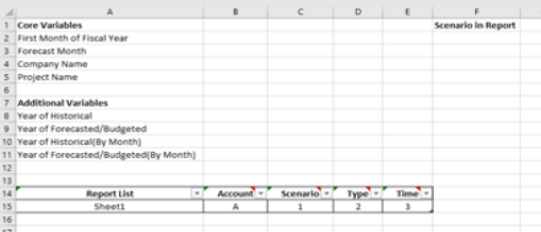
Each of these variables must be filled out. Note: For Company Name, Project Name, and Scenario Name in “Scenario in Report” must match EXACTLY to what it is in App.
For the Additional Variables Section Year of Historical and Year of Forecasted/Budgeted refers to the number of years. So, the answer for these would be 2 or 3 or however many are in the scenario. The By Month section is asking how many of those years are by month. So if a user has 5 historical years and all are by month, that number would be 5.
- Once the Workbook Level Settings Tab is filled out one more step remains before you can start pulling data and this is to generate the “behind the scenes” workbook that stores the scenarios info in its raw form. To do this right click anywhere and click “Setup” again. This will generate that workbook.
- Of note is the Layout Grid that is in rows 14 and 15 in the screenshot above. You don’t have to do anything here unless you want to change the layout of a report but this is where the add-in tells you what it will be looking for and where. In this case it will be looking for Account Names (or account numbers if you want to use them) in Column A, the name of the scenario to find those accounts in in Row 1, the type of data you want to pull (Historical, Budget, Actual, Forecast) in Row 2, and the time period you want to pull in Row 3 (the month or FY or YTD number you want to pull).
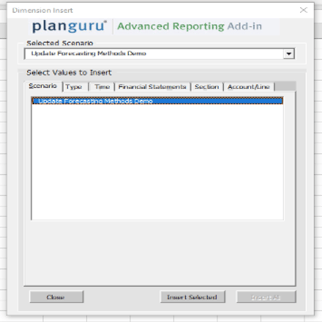
- At this point you can use the “Member Insert” menu to start inserting these variables. This can be done by manually typing in as well but usually it is far faster to use Member Insert.
- Once the variables are set you can start to pull the data. There are two pull options. Pull and Pull All. Pull only refreshes the data on the tab you’re currently on, while Pull All refreshes the data throughout all tabs in the workbook.
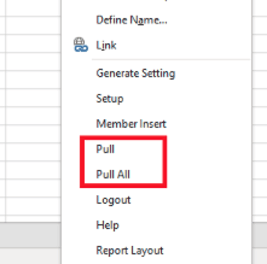
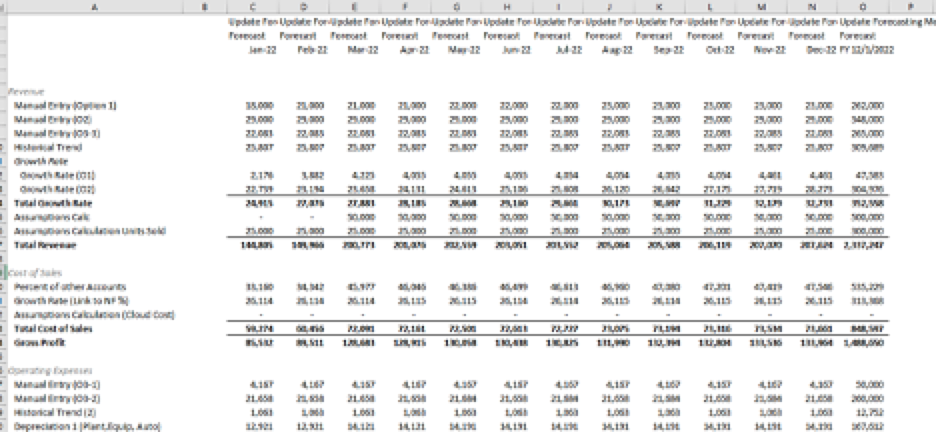
- Once the Pull or Pull All completes you should have the finished report!